| 3.5. Saving and re-opening plots | ||
|---|---|---|
 | Chapter 3. Manipulating track data |  |
| 3.5. Saving and re-opening plots | ||
|---|---|---|
| | Chapter 3. Manipulating track data | |
You may (or my not) know what the Replay file format used to load data into Debrief looked like. Whilst it is compact and easy to use, unfortunately the Replay file format does not allow us to store all of the formatting we have applied to the Debrief plot, nor the coordinates of what you are currently viewing, nor how you have arranged to store your data in layers. This problem is overcome by the use of the Debrief Plot-File format, an application defined using XML (see XML). Have a quick read about XML in the Reference Guide or Glossary if you're not aware of it and are sufficiently interested, otherwise, here's an overview:
Debrief stores plots in XML format with a custom DPF suffix
XML stands for eXstensible Markup Language, which allows structured data to be stored in text format, and is a world-wide standard promoted by http://www.w3c.org.
XML files can be edited outside Debrief, allowing you to cut and paste between plot-files to build up a new Plot-File, all in a text editor
Whilst a plot is typically created from an REP file, it may not be saved back into that REP file - it must be saved as a Debrief Plot-File ( DPF).
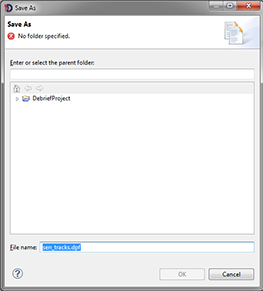
To save your work as a DPF file, click on the Save button:
 on the Workbench toolbar (or via the menu). A file dialog will open (see below), allowing you to save the current session in this format.
![[Note]](images/note.gif) | Note |
|---|---|
|
Debrief will only let you save the new plot into one of your project folders, so you must both select a folder and a provide a filename for the new file. Usefully, Debrief guesses that you probably want to name the plot the same as the REP file first loaded, but you can change this as required. |
Figure 3.20. Save-file dialog
Save-as functionality is provided through the button, next to the button in the menu.
With a plot already open, you are able to drag a Debrief
DPF or REP file into its chart, adding the content to the existing session. Dragging multiple files onto the plot area adds them all to the existing session. To create a composite plot like this, you can start by using Debrief's New Plot Wizard (see relevant Cheat Sheet, Tutorials)
| |  | |
| 3.4. Layer management |  | 3.6. Lightweight tracks |