| 7.5. ETOPO Data | ||
|---|---|---|
 | Chapter 7. External datasets |  |
| 7.5. ETOPO Data | ||
|---|---|---|
| | Chapter 7. External datasets | |
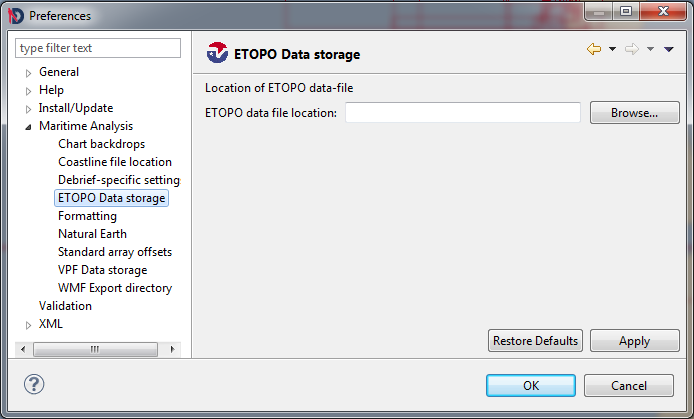
Debrief determines where to find the ETOPO data using the tab of the dialog from the menu. Indicate the location of your ETOPO.RAW datafile using the file-browser button.
Note: recent distributions of ETOPO include the dataset in several different forms. The one suited to Debrief is titled ETOPOv2c.i2_MSB.bin
Figure 7.15. ETOPO preferences
Debrief 2002 added the capability to view gridded bathymetric data, provided through the ETOPO dataset. The ETOPO dataset and its use is explained in more detail in Section 3.2.8, “ETOPO gridded bathy”.
![[Note]](images/note.gif) | Note |
|---|---|
|
The 'ETOPO-5' data set is originally from the U.S. National Geophysical Data Center (NGDC) in Boulder, Colorado (USA), and represents the "best" available digital terrain values as integrated from existing five and ten-minute digital sources. The data set has elevation values spaced at every five-minute latitude/longitude crossing on the global grid (approx. nine km.-sq. spatial resolution, or 12 x 12 pixels/degree), and a one-meter contour interval. Bathymetric values are included in this data set, starting at approximately 10,000 meters below sea level, while the elevation values extend up to heights of approximately 8,000 meters above sea level. Some original sources of the data used include the U. S. Defense Mapping Agency for the conterminous USA, Japan and Western Europe; the Australian Bureau of Mineral Resources, and the New Zealand Department of Scientific and Industrial Research. GRID has reformatted the original NGDC data file to place the origin at 180 degrees West longitude, instead of at 0 degrees Greenwich Meridian. The 'ETOPO-5' data file has 2160 records of data with a length of 8640 bytes each: the size of the data array is 2160 lines by 4320 elements, but this is a l6-bit or two bytes per element data file. The origin of the data file is at 90 degrees North latitude and 180 West longitude, and it extends to 90 degrees South latitude and 180 degrees East longitude. The data file comprises 18.66 Megabytes. The version of this data file at GRID has been discovered to contain two records (lines) of flawed data values; that is, portions of lines 2055 and 2056, beginning at the Weddell Sea north of Antarctica and continuing eastward. GRID is currently waiting for a response from the data supplier (NGDC) before attempting any replacement of what appear to be anomalous data values. There are two useful references for the 'ETOPO-5' data set. These are: "Edwards, Margaret Helen, 1986. Digital Image Processing of Local and Global Bathymetric Data. Master's Thesis. Department of Earth and Planetary Sciences, Washington Univ., St. Louis, Missouri, USA, 106 p." and "Haxby, W. F. et al., 1983. Digital Images of Combined Oceanic and Continental Data Sets and their Use in Tectonic Studies. EOS Trans- actions of the American Physical Union, vol. 64, no. 52, pp. 995-1004." |
| Note |
|---|---|
|
In November 2002 the capability to read the US NOAA 'ETOPO-2' data set was been added to Debrief. The ETOPO-2 dataset may be purchased from the NOAA, and is delivered on CD-ROM. The ETOPO-2 CD-ROM itself contains several datasets. The Dataset supported by Debrief is the
These sources are summarised below: Figure 7.16. ETOPO2 data sources 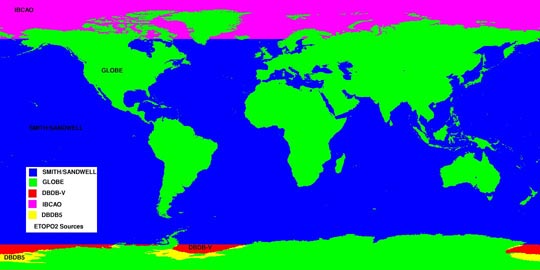 This information has been taken from the NOAA Web-site. |
The following options are provided for plotting ETOPO data:
The color to plot the key itself.
This option determines where (and whether) to show the key for the depth data. Note that the ETOPO data will always appear behind other data, so it may be necessary to experiment with the key location.
Whether to plot land as land, or as very shallow water. Plotting the land as very shallow water is the favoured way of combining ETOPO data with VPF data. The VPF coastline data is of much higher resolution, differences being highlighted when ETOPO land is shown.
Whether to plot the ETOPO data.
The ETOPO-2 dataset provides a few more customizable attributes, which allow you to choose between enhanced performance over appearance in the plot:
This is the size of each bathy square to be plotted in screen pixels. A resolution (Res) of 1 pixel provides the most detailed bathymetric plot, though it takes the longest time. Frequently it is possible to increase the bathy-res without any visible degradation in the data displayed - whilst providing performance benefits
This flag indicates whether the bathymetric plot should be shown or not (sometimes the set of contours are sufficient).
Into this box provide a comma-separated list of depth contours (in metres) to plot. The values should expressed in ascending order as whole numbers. If Debrief encounters a problem whilst reading the values it will return to the last valid set of depths
The contour plotting algorithm is very processor-intensive, calculating the contours when zoomed out over a large area can take many minutes. The contour plotting algorithm inspects every depth datum in the data area whilst finding contours. The speed of calculation can be improved by directing the algorithm to skip a number of depth values before performing the next calculation. This may make the contours themselves very slightly more blocky, though still usable.
Setting this switch instructs Debrief to automatically increase the Contour Grid Interval as you zoom from the plot. This prevents the exponential increase in time take to conduct the contouring, ensuring that no more than 10000 calculations are performed, and when zooming in it ensures that where applicable at least 2000 calculations are performed.
This flag indicates whether the contours should be plotted or not - not showing contours substantially speeds up the redraw time.
![[Tip]](images/tip.gif) | Tip |
|---|---|
|
The ETOPO-5 dataset uses a significant amount of memory on your PC, typically 30Mb, though this only gets loaded once per Debrief session, however many plots are loaded. Writing a WMF file with ETOPO data visible requires even more memory, and can cause Debrief to hang or crash. This problem can be overcome by following the advice described in Section 15.1.6, “Starting the program”. The ETOPO-2 dataset is many times larger than ETOPO-5, thus is not read into memory but accessed on the fly. For this reason it does not consume as much memory, but does require a fast PC to produce acceptable screen updates. |
| |  | |
| 7.4. Configuring VPF defaults |  | Chapter 8. Exercise planning |